Our Impact
Blueprint has a demonstrated record of proven effectiveness collaborating with districts and schools to promote rapid, significant, and sustainable improvement in academic achievement for all students, including those from high-poverty backgrounds, English Language Learners, and students with disabilities. In settings where students often face significant challenges to academic success, including poverty, language acquisition, and disabilities, Blueprint is supporting urban schools across the nation in achieving demonstrable gains in student learning.
2020 - 2022 Mathematica Study Results
During the 2020-21 and 2021-22 school years, Mathematica conducted a study funded by the Bill and Melinda Gates Foundation to learn about innovative approaches to tutoring as part of its Middle Years Math body of work. Here are the results of Blueprint’s participation in that study.
Current Data
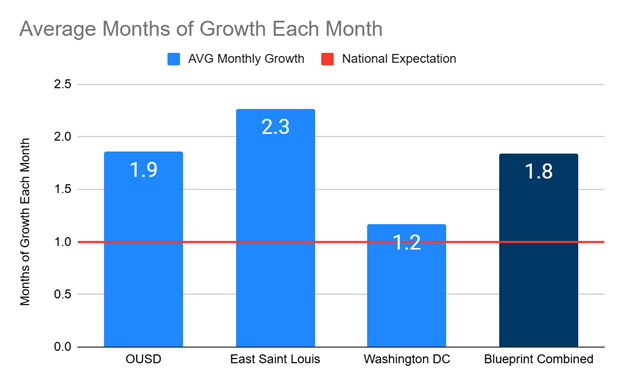
The Renaissance STAR Math Assessment is a computer-adaptive test assessing students' math skills and progression throughout the school year. Blueprint Scholars take the STAR-Math Assessment to determine progress throughout the school year. In essence, each student is expected to make a month's worth of growth each month to project a scholar to be on grade level each month. Highlighted in the graph below, Blueprint scholars on average made 1.8 months of growth each month nationally. Individual regions are highlighted as well. In these regions, Blueprint scholars are closing opportunity gaps!

Student & Fellow Perception Surveys
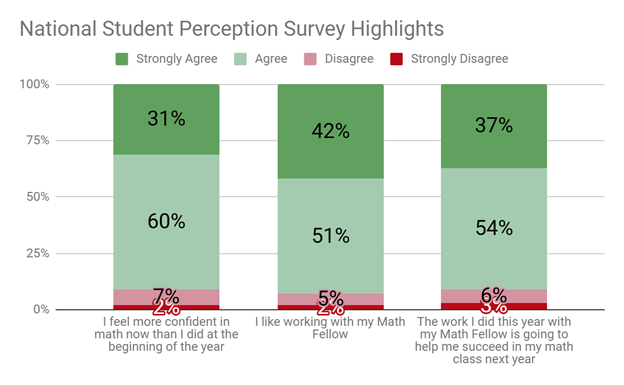
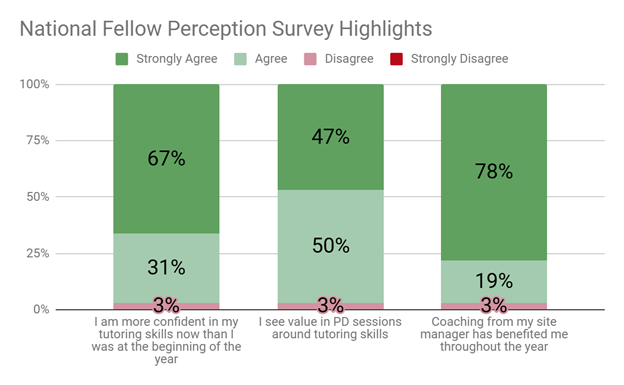
Three times each year, Blueprint administers comprehensive perception surveys to both students and Math Fellows (tutors). These surveys gather feedback on a range of topics, including students’ understanding of their current math knowledge and future goals, their satisfaction with their Math Fellow, and the impact of tutoring on their confidence in math. For Math Fellows, we collect input on their growth as tutors, the value of professional learning opportunities, and the quality of coaching and support provided by their site manager. The perception surveys are aligned with the Math Fellows Program’s three core goals and provide timely, actionable insights into our progress toward: (1) closing opportunity gaps in math, (2) building student confidence and enjoyment in math, and (3) supporting pathways from tutor to teacher.
Student Perception Survey

Here’s what students are saying about their experiences with Blueprint Math Tutoring:
Fellow Perception Survey

Here’s what Fellows say about their experiences as a Blueprint Math Fellow:
Past Partners
PAUL A. DEVER ELEMENTARY SCHOOL (BOSTON, MA)
From 2014-2017 Blueprint served as the School Operator at the Dever Elementary School. For the first time in 20 years, Dever students' math performance matched or outpaced that of Boston Public Schools and state students.
Students in grades 2 through 5 at Dever Elementary School take the Achievement Network (ANet) assessment four times per year in both English Language Arts and Math. On the December 2016 ANet assessment, students in grades 2 through 5 matched the average score of 54 mostly Level 1, 2, and 3 schools in Massachusetts in English Language Arts (ELA) and ranked #7 out of 37 schools in Math.
As a result of 2016-2017 achievement testing, one out of every six students in the 5th grade at Dever is eligible to enroll in an Advanced Work Program when they matriculate to 6th grade next year.
BENTLEY ACADEMY CHARTER SCHOOL (SALEM, MA)
Blueprint served as the School Operator for the Bentley Elementary during the 2014-2015 school year and as a partner with the school, known as Bentley Academy Charter School as of 2015-2016 school year, until 2017. After one year, the school had the highest percentage of students scoring proficient or advanced in Math in school history.
In English Language Arts, the percent of students scoring proficient or advanced on the 2015 MCAS was the highest in nine years (2006) and the second highest school history.
Student growth in ELA was the highest in seven years (2008) and the second best in school history.
After two years of partnership, Bentley moved from Level 4 status (chronically underperforming) to Level 1 on the Massachusetts Framework for District Accountability and Assistance.
During the final year partnering with the Bentley, the student growth percentile in 4th grade math was the highest in school history and the percentage of students scoring in the lowest category was the lowest in school history. The student growth percentile increased from 59 in 2015 to 83.5 in 2017 and the percentage of students scoring in the lowest category on the MCAS dropped from 12% to 0%. 4th grade students who met or exceeded expectations on the MCAS increased from 42% to 63%. The 63% of students marked the first time in the 20 year history of MCAS testing that the Bentley met or exceeded the Massachusetts average (49% in 2017). 2017 also marked the first year in school history that no students scored in the lowest category (warning) on the MCAS.
BOSTON PUBLIC SCHOOLS
In 2015, after two years of school improvement partnership with English High School, the percentage of students scoring proficient or advanced in English Language Arts (ELA) was the highest since MCAS testing began 17 years ago.
The percentage of students scoring proficient or advanced in Math was the highest in 17 years.
The percentage of English Language Learners scoring proficient or advanced in ELA in was the highest in school history.
On the 2015 MCAS, English High School had the highest student growth rate in Math in school history.
On the 2015 MCAS, 10th graders at English High School had the highest growth in Math in Massachusetts.
In 2015, after two years of partnership with Elihu Greenwood Leadership Academy (K-5), the school ranked #3 for student growth performance in Math and #15 for ELA out of 87 schools in Boston that administered the 2015 PARCC.
5th graders at Elihu Greenwood Leadership Academy had the highest math growth in Massachusetts during the 2014-2015 school year.
DENVER PUBLIC SCHOOLS
In 2012, after one year of partnership, all schools in Denver that implemented Blueprint’s five school improvement strategies:
- Outperformed Denver Public Schools in percentage point gain for students scoring either proficient or advanced in reading.
- Three out of six schools ranked in the top 7% of schools statewide for growth in reading.
- All partner schools ranked in the top 13% of 1,829 schools in the State of Colorado for student growth in math using Colorado’s Median Growth Percentile metric.
Out of 992 elementary schools in Colorado:
- Green Valley Elementary School ranked #3 for student performance growth in Math and #49 for reading.
- McGlone Elementary School ranked #9 for student performance growth in Math and #59 for reading.
Out of 336 high schools in Colorado:
- High Tech High School ranked #5 for student performance growth in Math, which is greater than 98% of all other high schools in Colorado.
- Collegiate Prep Academy ranked #25 for student performance growth in Math.
- Out of 501 middle schools in Colorado, Noel Community Arts ranked #20 for student performance growth in Math.
- Denver Center for International Studies ranked #64 for student performance growth in Math.
For the first time in its 33 year history, Montbello High School in Denver Public Schools saw 100% of its graduating seniors accepted to a two or four year post-secondary school in 2013.
